


Offizieller Lieferant
Als offizieller und autorisierter Distributor beliefern wir Sie mit legitimen Lizenzen direkt von mehr als 200 Softwareherstellern.
Sehen Sie alle unsere Marken.
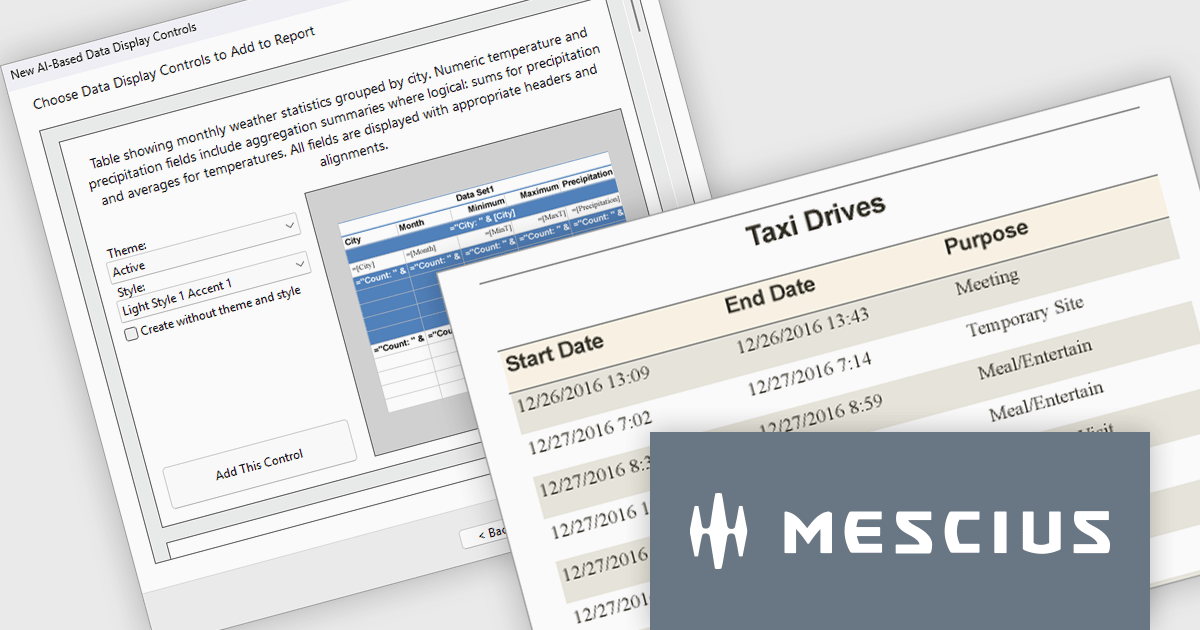
ActiveReports.NET by MESCIUS is a reporting solution for the Microsoft .NET platform that enables developers to create and deliver data-driven reports in web, desktop, and cloud applications. It supports multiple report types, including section, page, and RDL (Report Definition Language) reports, and provides visual designers, a robust rendering engine, and export options such as PDF and Excel. Designed to integrate with modern .NET and ASP.NET Core applications, it helps teams build interactive, enterprise-grade reporting features into their software.
The ActiveReports.NET v20.1 update includes AI Driven Smart Data Regions, enabling developers to generate cleaner and more consistent report layouts automatically. By applying standardized date formatting, removing duplicate columns, and using structured grouped table layouts with appropriate headers, footers, and page breaks, it reduces the need for manual report refinement while improving readability and navigation. This enhancement helps development teams deliver professional quality reports more efficiently and ensures more consistent results from AI generated report designs.
To see a full list of what's new in v20.1, see our release notes.
ActiveReports.NET is licensed per developer. Dependent on geographic location it is available as either an Annual (Timed) Subscription License or as a Perpetual Developer License which comes with 1 year of software updates and support. Each developer requires a license to design, develop, or maintain applications. The Annual Subscription License must be renewed each year to continue to work with the software. Published applications are royalty free and do not expire. Optional pipeline licenses available for CI/CD build servers. See our ActiveReports.NET licensing page for full details.
Learn more on our ActiveReports.NET product page.
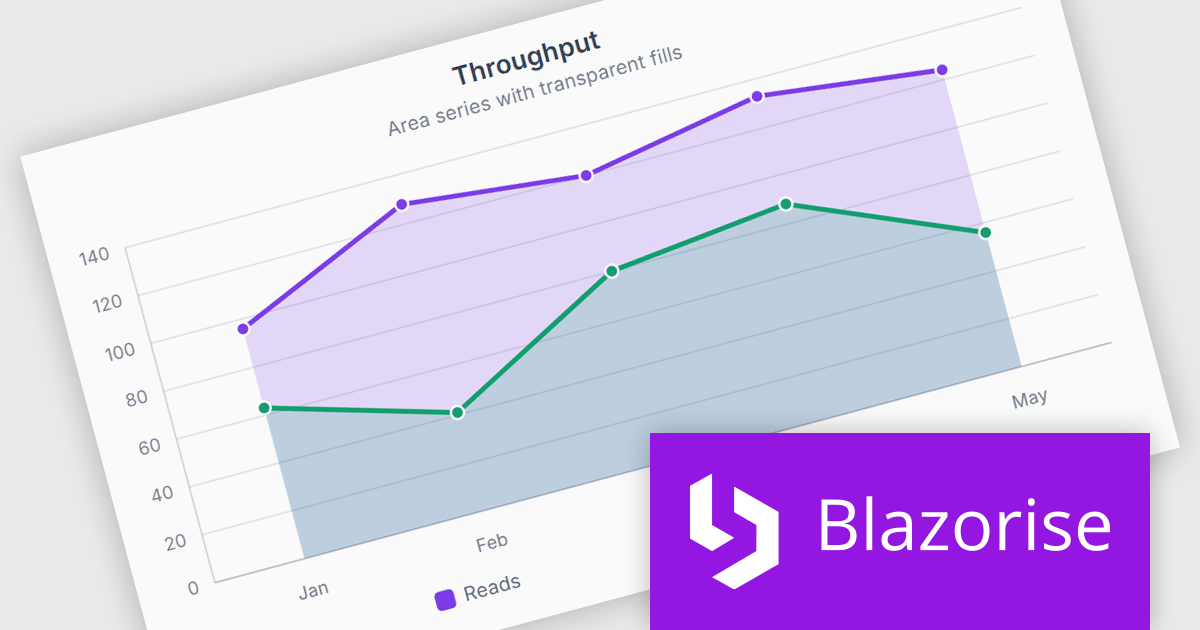
Blazorise is a versatile component library that empowers developers to build modern and feature-rich web applications using Blazor, a client-side web development framework from Microsoft. It offers a comprehensive collection of user interface components, including buttons, forms, charts, and navigation elements, all built with accessibility and responsiveness in mind.
The Blazorise 2.2 update introduces SVG Charts, a native charting engine built with C# and Blazor that simplifies the development of dashboards, reports, and other data driven applications. By eliminating the need for external JavaScript charting libraries, it reduces development complexity and allows developers to create interactive visualizations using familiar Blazor patterns.
To see a full list of what’s new in version 2.2, see our release notes.
Blazorise is licensed per developer and includes a 1 year subscription for updates and support. Professional, Enterprise, and Enterprise Plus editions are available, each offering tailored levels of support and service to meet varying business needs. See our Blazorise licensing page for full details.
For more information, visit our Blazorise product page.
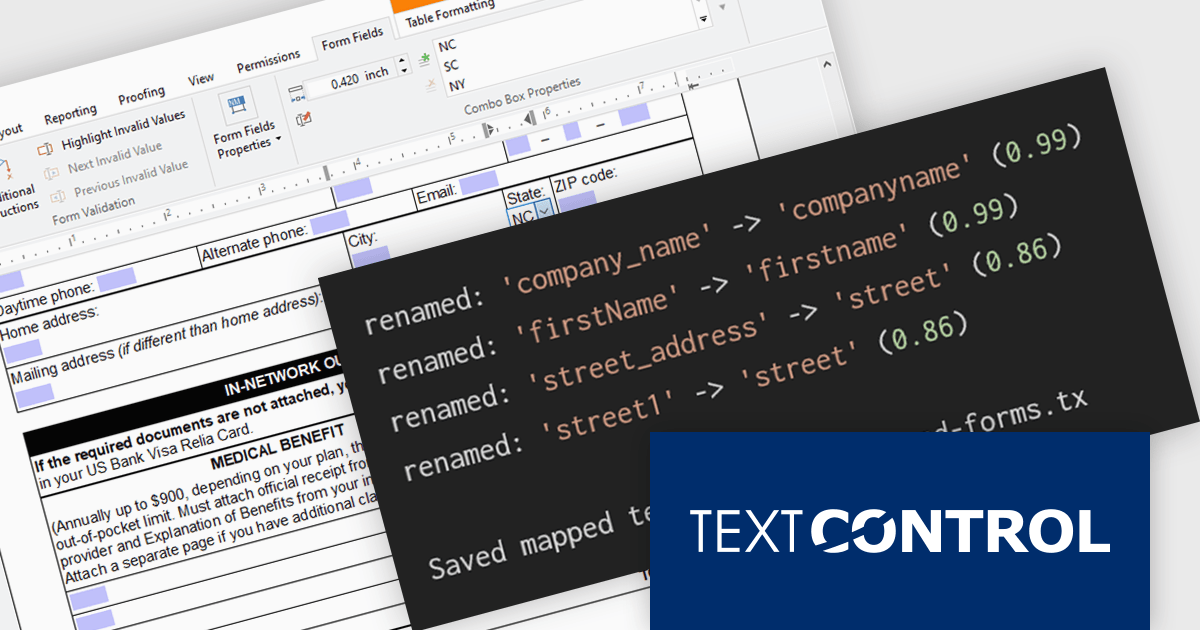
TX Text Control .NET Server for ASP.NET is a server side component for Web applications, or services. It is a fully programmable ASP.NET word processor engine that offers an extensive palette of word processing features. Using TX Text Control .NET Server, programmers can develop server side, end user applications that generate documents on-the-fly, using data from databases, binary files (Microsoft Word DOC and DOCX), ASCII files (XML, RTF, HTML) and image data (JPG, PNG, BMP, TIF, GIF, WMF). Documents can be created, modified and edited in a browser or printed in batch processes.
In this blog post from Text Control, Bjoern Meyer demonstrates how to automatically map TX Text Control form fields to JSON data in a .NET C# application, even when the names are not an exact match. It uses fuzzy matching and is especially useful in cases where templates and data sources evolve independently. The included sample project takes you through the following steps:
Read the complete blog and learn how to automatically prepare templates for JSOPN-based document workflows.
TX Text Control .NET Server for ASP.NET is licensed per developer and is available as a Perpetual License with a 12 month support and maintenance subscription. Run time licenses are required for the deployment to production servers. See our TX Text Control .NET Server for ASP.NET licensing page for full details.
For more information, visit our TX Text Control .NET Server for ASP.NET product page.
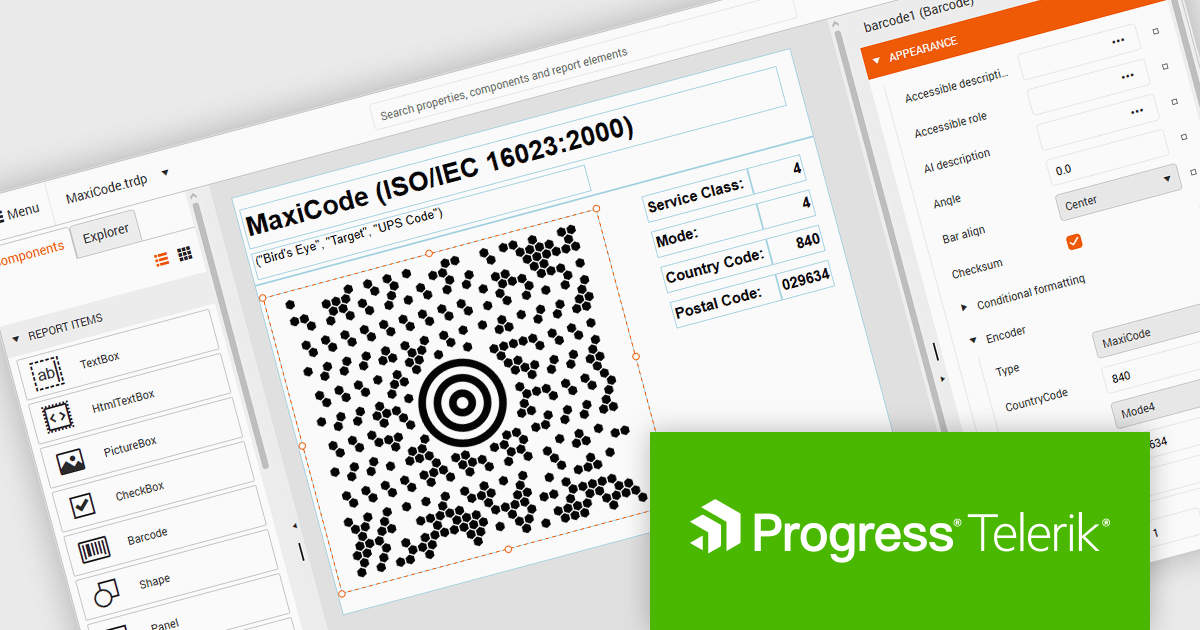
Telerik Reporting and Telerik Report Server deliver a complete solution for creating, managing, and distributing reports across .NET applications. Telerik Reporting is a lightweight, embedded reporting tool for .NET web and desktop apps. It lets developers and users easily design, customize, and export interactive, reusable reports. It supports multiple platforms, including ASP.NET Core, Blazor, MVC, AJAX, HTML5/JS, Angular, WPF, WinForms, and WinUI. Telerik Report Server is a web-based, server-side solution for centralized report management. Built on Telerik Reporting, it offers scheduling, delivery, user management, and web-based access. It can be used standalone or integrated into apps built with Blazor, Angular, or Windows Forms.
The Telerik Reporting and Report Server 2026 Q2 update adds MaxiCode barcode support, enabling developers to generate UPS-compatible shipping labels directly within Telerik reporting workflows without relying on separate labeling tools. The enhancement ensures accurate MaxiCode rendering across export formats including PDF, HTML, DOCX, XAML, Image, and RTF, while allowing barcode generation, scheduling, distribution, and reporting to be managed from a single platform. This helps organizations streamline shipping and fulfillment processes, automate high-volume delivery workflows through scheduled reports and data alerts, and reduce operational complexity.
To see a full list of what's new, see our release notes for Telerik Reporting and Telerik Report Server 2026 Q2.
Telerik Reporting is licensed per developer and is available as an Annual Subscription License, which includes product updates, technical support, AI Productivity Tools, and other benefits for 12 months. Telerik Report Server is licensed per domain, with each license including 15 Client Access Licenses (CALs) and 12 months of support and maintenance. See our licensing pages for full details. See our licensing pages for Telerik Reporting and Telerik Report Server for full details.
Telerik Reporting and Telerik Report Server are available individually or as part of Telerik DevCraft Ultimate.
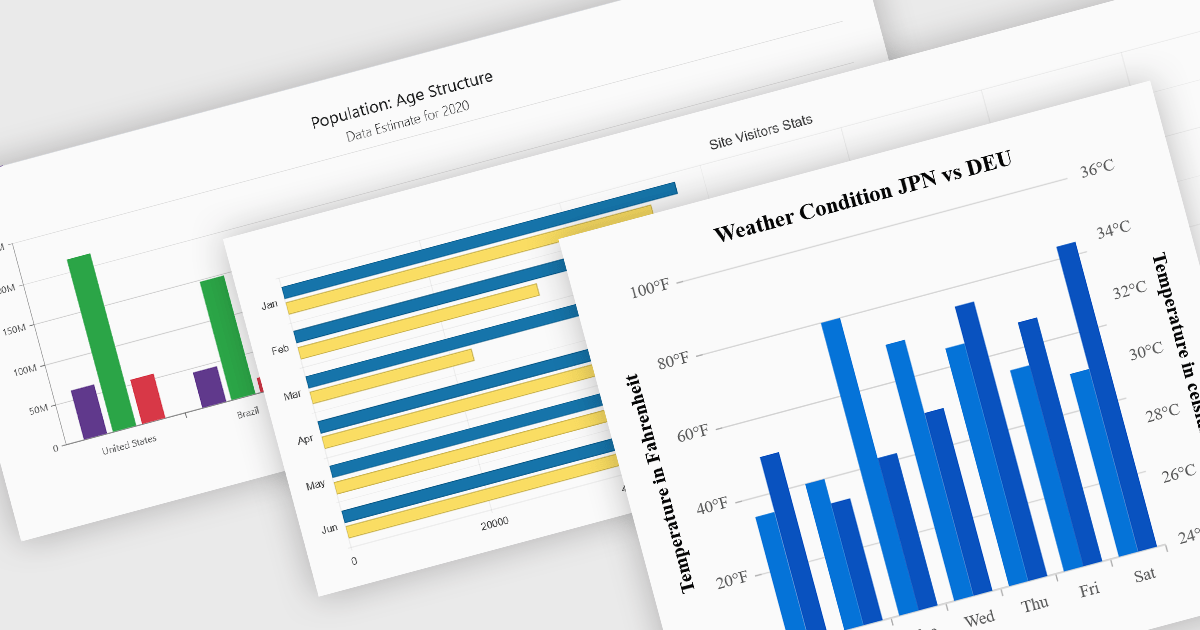
Column and bar charts are among the most widely used data visualization features in modern charting components, helping developers present comparisons, trends, and category-based metrics in a format that is easy to interpret. By displaying values as horizontal or vertical bars, these chart types allow applications to communicate changes in performance, rankings, distributions, and other business data with clarity. Modern charting components typically support customization options such as stacked series, grouped categories, animations, tooltips, responsive layouts, and interactive behaviors, enabling developers to create dashboards and reporting experiences that suit a wide range of enterprise and analytical scenarios.
Several Blazor chart controls offer column and bar charts including:
For an in-depth analysis of features and price, visit our Blazor chart controls comparison.


Tel.: (888) 850 9911
Fax: +1 770 250 6199


