













Proveedor oficial
Como distribuidores oficiales y autorizados, le suministramos licencias legítimas directamente de más de 200 editores de software.
Ver todas nuestras marcas.
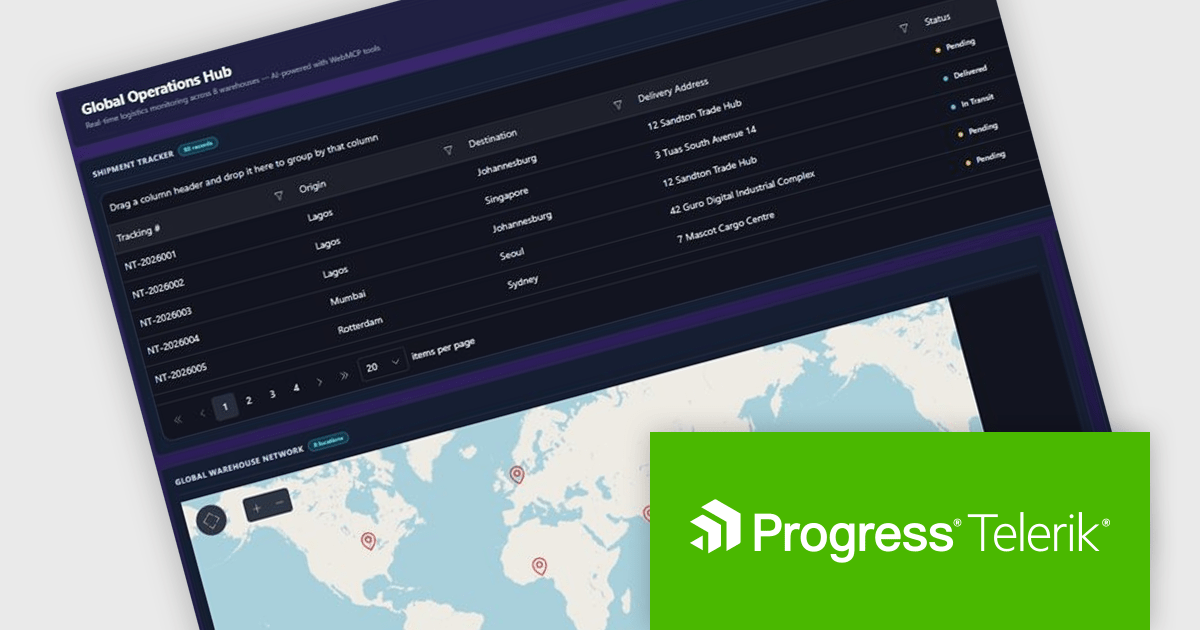
DevCraft by Telerik is a comprehensive suite of more than 1,250 UI components and development tools designed for building modern web, desktop, and mobile applications using .NET and JavaScript frameworks. It includes reporting and report management solutions, automated testing and mocking tools, and document processing libraries, as well as a wide range of professionally designed user interface controls from the Telerik and Kendo UI suites. DevCraft enables developers to create feature-rich, high-performance applications with consistent design and user experience, delivering enterprise-level, scalable, and maintainable software solutions.
The Telerik DevCraft 2026 Q2 update introduces WebMCP integration as a preview feature, enabling developers to explore applications that work directly with AI agents through structured interactions. By exposing application functionality as actionable tools, it allows AI agents to perform tasks such as filtering data, navigating views, and updating values without relying on DOM scraping or simulated user actions. This preview helps developers evaluate more reliable AI driven workflows, simplify the implementation of intelligent application experiences, and prepare their applications for emerging AI standards and use cases.
To see a full list of what's new in DevCraft 2026 Q2, see our release notes.
Telerik DevCraft is licensed per developer and has two licensing models: an annual Subscription License and a Perpetual License. The Subscription license provides access to the latest product updates, technical support, and exclusive benefits for a flat annual fee, and must be renewed to continue using the software. The Perpetual license is a one-time purchase granting access to the current released version and includes one-year Maintenance and Support. After this initial period, users can choose to renew Maintenance & Support to continue receiving updates and support; otherwise, they may continue using the installed version available during their active maintenance period but will forgo future updates and support. See our Telerik DevCraft Ultimate licensing page for full details.
For more information, see our product pages:
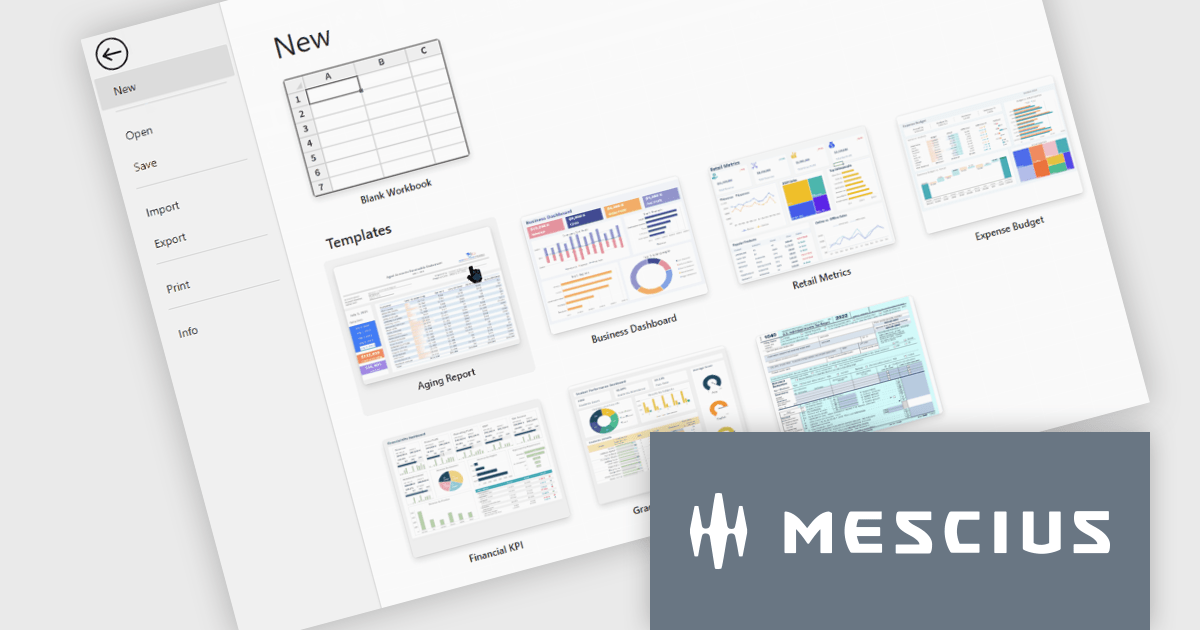
SpreadJS is a JavaScript spreadsheet and data visualization component built to deliver Excel-compatible functionality within web applications. It provides a flexible, high-performance interface for displaying and manipulating tabular data, supporting advanced features such as formulas, pivot tables, charts, conditional formatting, and data binding. SpreadJS integrates smoothly with popular frameworks like React, Angular, and Vue, and includes robust import and export capabilities for Microsoft Excel files. It is commonly used in enterprise applications where users need a responsive, interactive spreadsheet experience directly in the browser.
The SpreadJS 19.1.0 update enhances the designer with a new templatesConfig option, allowing developers to define template configurations for new workbooks. By loading templates from remote sources or preloaded data, applications can apply consistent styles and formats during initialization or reset operations, helping teams standardize workbook creation and simplify spreadsheet setup.
To see a full list of what's new in 19.1.0, see our release notes.
SpreadJS is licensed per developer and includes 1 Year Maintenance (major and minor version releases and unlimited support phone calls). SpreadJS requires an Annual or Perpetual Deployment License. The optional Add-ons are available at an additional cost, and require a SpreadJS license. See our SpreadJS licensing page for full details.
For more information, visit our SpreadJS product page.
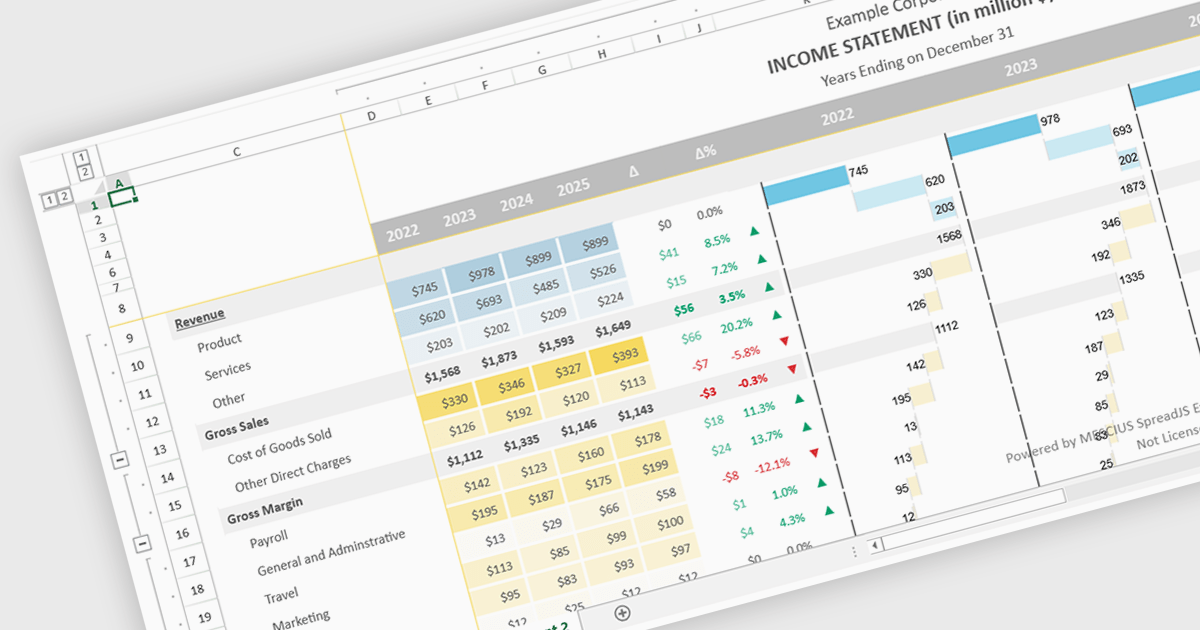
Conditional formatting support in a React spreadsheet component allows developers to apply dynamic visual styling to cells based on defined rules, values, formulas where supported, or predefined conditions, such as highlighting trends, thresholds, errors, or status changes as data changes. This capability improves data readability and usability by helping users identify important information quickly without manual analysis, while also enabling more interactive and responsive data-driven applications. For software developers, it provides a familiar spreadsheet experience within React applications, reduces the need for custom rendering logic, and supports the creation of dashboards, financial tools, reporting systems, and enterprise data management interfaces with clearer visual context.
Several React spreadsheet controls support conditional formatting including:
For an in-depth analysis of features and price, visit our React spreadsheet controls comparison.
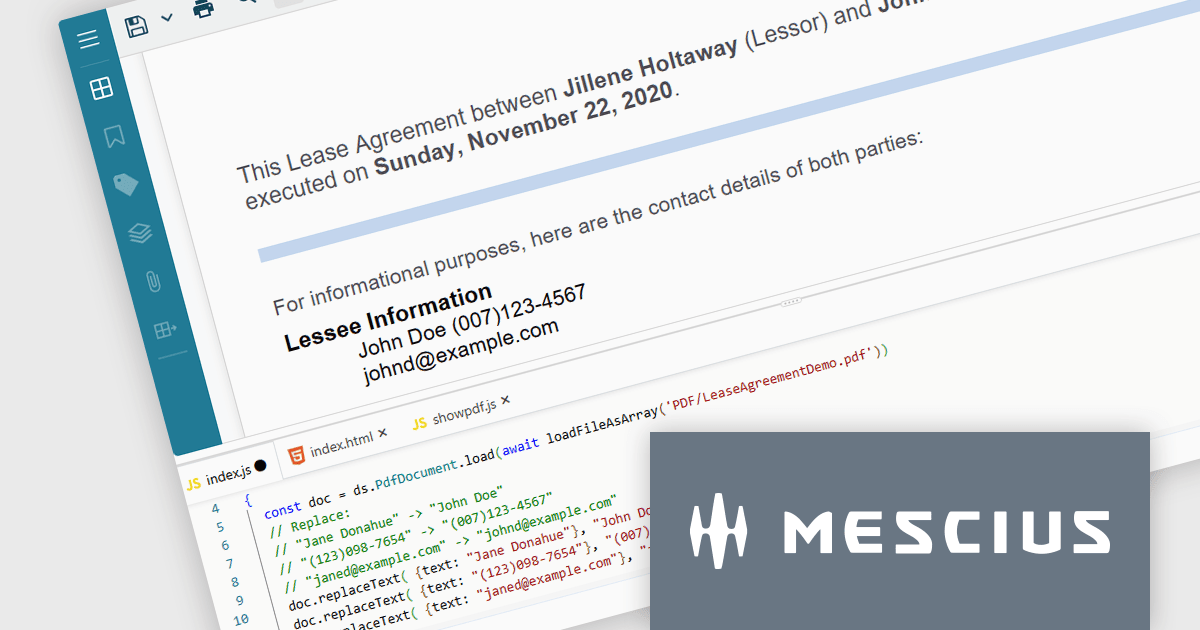
Document Solutions for PDF JS by MESCIUS is a JavaScript PDF API that enables software teams to add PDF functionality to web applications. It supports use cases such as generating documents, modifying existing files, rendering pages, handling forms, converting content, and automating PDF-related processes across browser-based and server-side JavaScript environments.
Beyond core document processing, the product provides tools for creating richer document workflows within custom applications. Its WebAssembly-based engine is designed for efficient performance, while the optional viewer component supports interactive scenarios such as annotation, review, and form filling. This gives teams more control over how PDFs are handled and helps reduce reliance on separate PDF software in reporting, compliance, data collection, and collaboration scenarios.
Document Solutions for PDF JS is licensed per developer and is available in several license options for differing distribution needs. Team licenses are also available for multiple developers within the same organization. See our Document Solutions for PDF JS licensing page for full details.
Learn more on our Document Solutions for PDF JS product page.
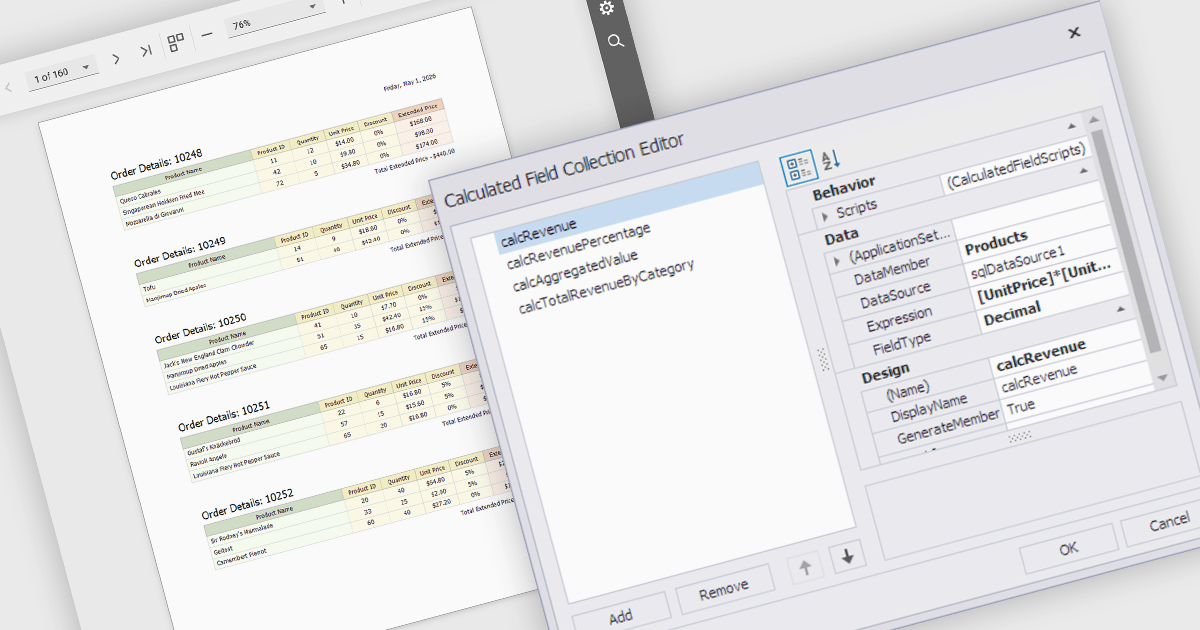
Calculated fields are dynamic values derived from existing data within reporting components. They enable complex data manipulations, calculations, and transformations, providing enhanced data analysis capabilities. By creating new fields based on existing data, calculated fields offer flexibility and efficiency, allowing users to perform calculations, aggregations, and logical comparisons directly within the report. This empowers users to generate insights, visualize trends, and make data-driven decisions without requiring modifications to the underlying data source, ultimately improving report accuracy and usability.
Several React reporting controls offer support for calculated fields:
For an in-depth analysis of features and price, visit our React reporting controls comparison.
Tel: (888) 850 9911
Fax: +1 770 250 6199


