


Official Supplier
As official and authorized distributors, we supply you with legitimate licenses directly from 200+ software publishers.
See all our Brands.

For the past three years, ComponentSource and Jspreadsheet have worked together to provide developers with powerful spreadsheet and data management solutions for modern web applications. Jspreadsheet offers Excel like functionality for JavaScript, React, Angular, and Vue applications, helping teams create interactive data grids, forms, dashboards, and business applications that can handle large volumes of data with exceptional performance.
A key product in this collaboration is Jspreadsheet Pro, the brand’s flagship spreadsheet component. Featuring more than 400 built in formulas, advanced data handling capabilities, and extensive customization options, it enables developers to deliver familiar spreadsheet experiences directly within their web applications while maintaining full control over data integration and persistence.
This partnership helps ComponentSource differentiate its product offering by providing customers with a market leading spreadsheet solution that complements its extensive portfolio of developer tools. Through ComponentSource’s global sales, licensing, and support services, developers worldwide can easily discover, evaluate, purchase, and deploy Jspreadsheet Pro within their projects.
Learn more about Jspreadsheet.
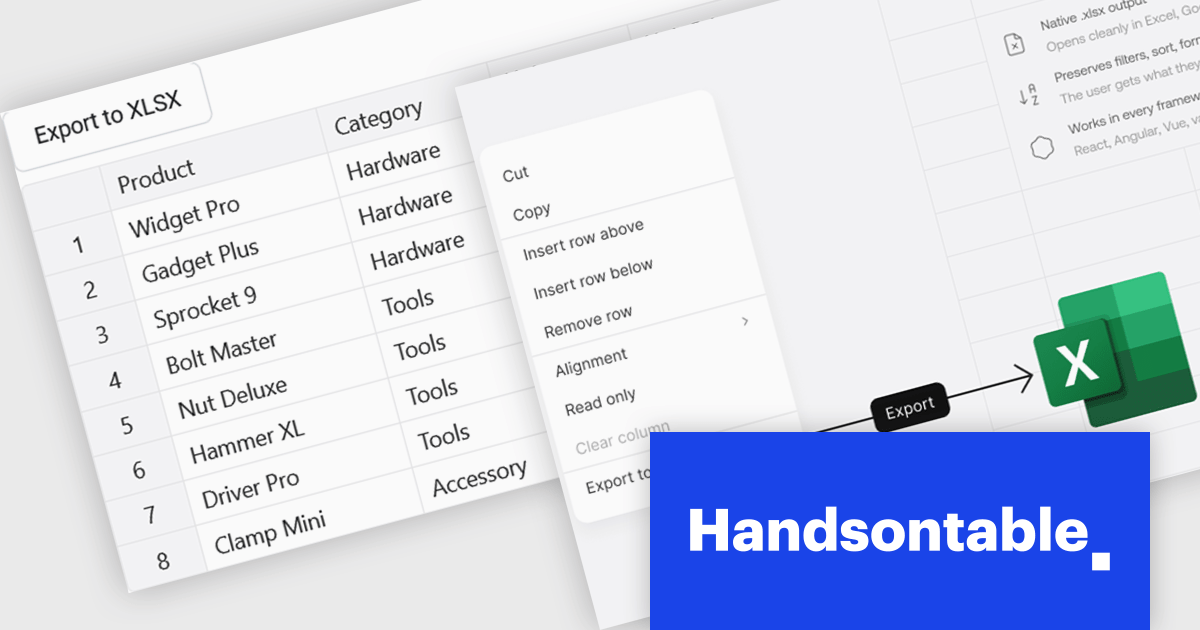
Handsontable is a JavaScript library designed to help developers build interactive data grids into their web applications. Offering a familiar spreadsheet-like interface, it allows users to edit, sort, and filter data with ease. Highly customizable and compatible with popular frameworks like React and Angular, Handsontable empowers developers to build robust data manipulation features into their web applications.
The Handsontable 17.1.0 update includes native export to Excel support, allowing users to save rendered grid data directly to XLSX format. The export reflects the current view of the table, including column order, visible columns, applied filters, sort order, frozen rows and columns, and merged cells. Cell types such as numbers, dates and checkboxes are mapped to their Excel equivalents where possible, helping exported files open cleanly in Microsoft Excel, Google Sheets and Apple Numbers without additional formatting or data preparation. This makes it easier to share and analyze data while maintaining the structure and context users see within the grid.
To see a full list of what's new in version 17.1.0, see our release notes.
Handsontable is licensed per developer and is available as an Annual or Perpetual license with 1 year support and maintenance. See our Handsontable licensing page for full details.
For more information, visit our Handsontable product page.
TX Text Control .NET Server for ASP.NET is a server side component for Web applications, or services. It is a fully programmable ASP.NET word processor engine that offers an extensive palette of word processing features. Using TX Text Control .NET Server, programmers can develop server side, end user applications that generate documents on-the-fly, using data from databases, binary files (Microsoft Word DOC and DOCX), ASCII files (XML, RTF, HTML) and image data (JPG, PNG, BMP, TIF, GIF, WMF). Documents can be created, modified and edited in a browser or printed in batch processes.
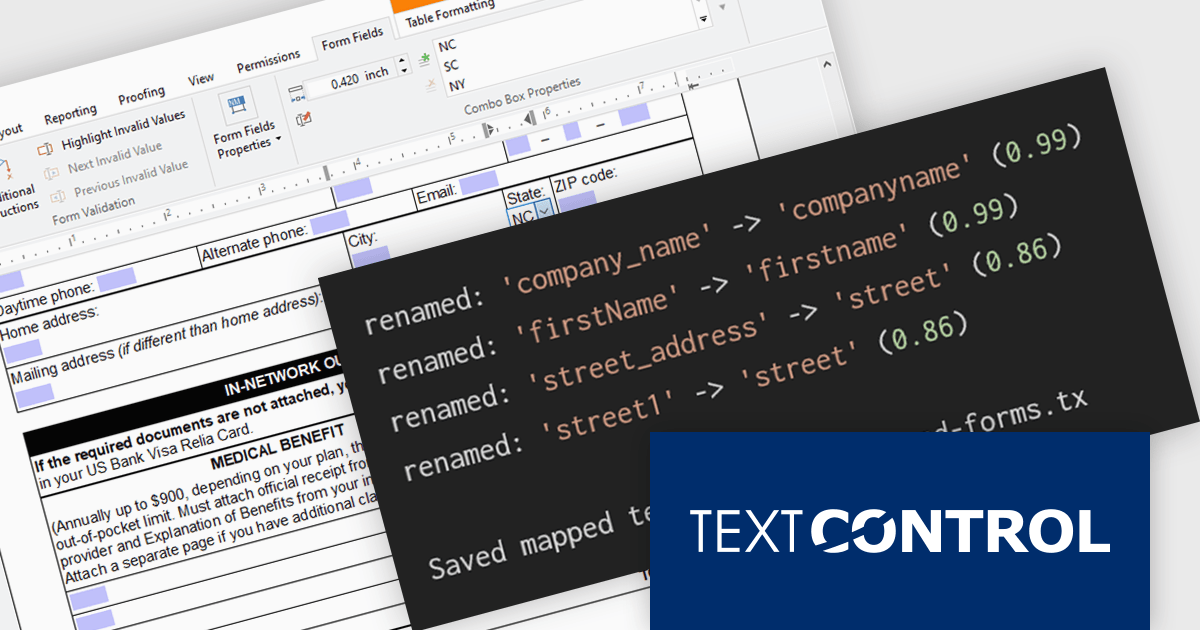
In this blog post from Text Control, Bjoern Meyer demonstrates how to automatically map TX Text Control form fields to JSON data in a .NET C# application, even when the names are not an exact match. It uses fuzzy matching and is especially useful in cases where templates and data sources evolve independently. The included sample project takes you through the following steps:
Read the complete blog and learn how to automatically prepare templates for JSOPN-based document workflows.
TX Text Control .NET Server for ASP.NET is licensed per developer and is available as a Perpetual License with a 12 month support and maintenance subscription. Run time licenses are required for the deployment to production servers. See our TX Text Control .NET Server for ASP.NET licensing page for full details.
For more information, visit our TX Text Control .NET Server for ASP.NET product page.
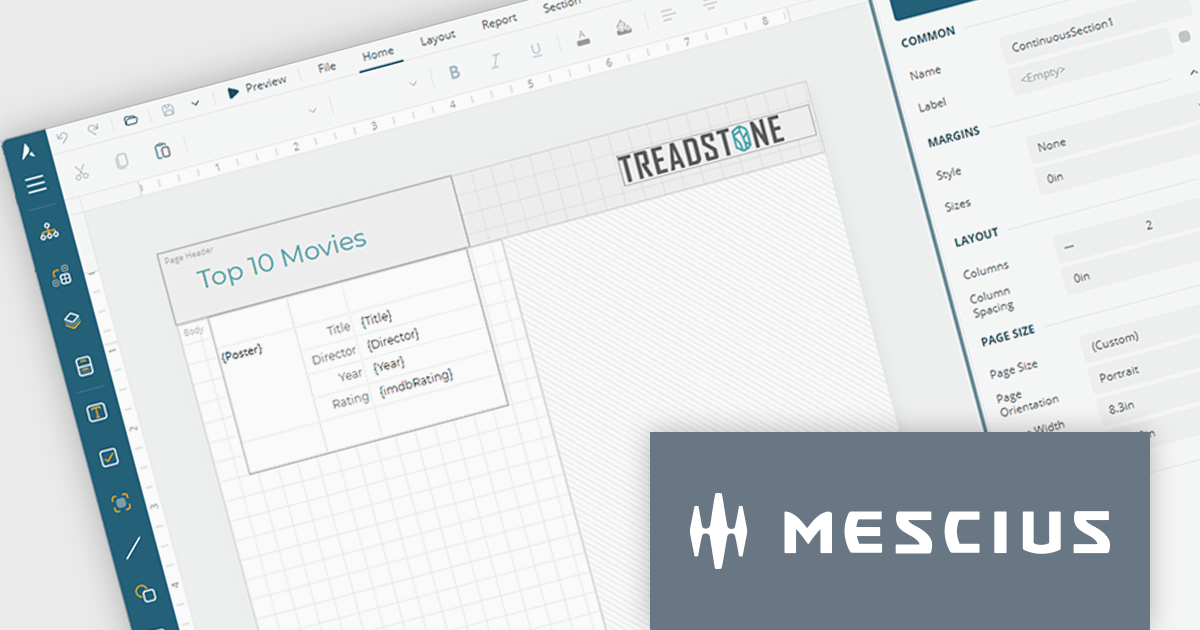
ActiveReportsJS by MESCIUS is a JavaScript reporting toolkit that allows developers to design and embed interactive reports within web applications. It includes a standalone report designer for building reports visually and a JavaScript report viewer component that integrates with web frameworks such as React or vanilla JavaScript. The toolkit supports a range of data visualization options and export formats, helping developers deliver rich, interactive reporting capabilities in the browser.
The ActiveReportsJS Report Designer now offers a more intuitive design-time experience for multi-column reports. Column splits are displayed directly on the design surface, providing clear visual guidance when creating report layouts. To help maintain layout accuracy, controls can be placed in the primary column while additional columns are automatically generated at runtime as content grows. This approach makes it easier to design, preview and manage multi-column reports while reducing the risk of unexpected layout issues.
To see a full list of what's new in 6.1, see our release notes.
ActiveReportsJS is licensed on an annual subscription or perpetual basis and is available as a Single Deployment License for non-commercial use, and as a Single Domain License or Unlimited Domain License for commercial and/or SaaS use. See our ActiveReportsJS licensing page for full details.
Learn more on our ActiveReportsJS product page.
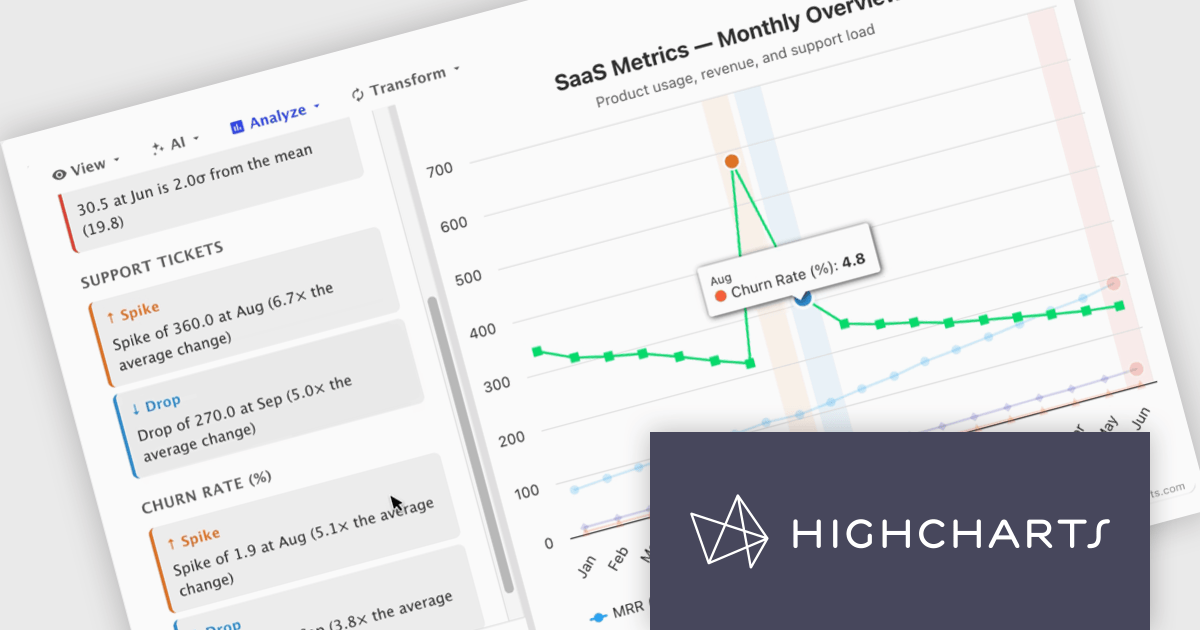
Highcharts Core (formerly Highcharts JS) is an SVG-based, multi-platform charting library that has been actively developed since 2009. It makes it easy to add interactive, mobile-optimized charts to your web pages and mobile projects. It features robust documentation, advanced responsiveness, and industry-leading accessibility support.
In this blog post, Highcharts' Nancy Dillon introduces you to Highcharts Orbit - A full analytics layer for any Highchart that helps you understand your data via a suite of analysis tools for forecasting, anomaly detection, and reporting. Add it to any Highcharts setup and a toolbar appears above the chart, giving you access to these powerful tools using four menus:
Read the complete blog post and download the fully-featured Preview version now!
Highcharts Core is licensed on an annual or perpetual basis, OEM licenses, and Advantage Renewals. It is licensed per Developer and has several license options including Internal, SaaS, SaaS+, and Self Hosted. See our Highcharts Core licensing page for full details.
Learn more on our Highcharts Core product page.


Tel: (888) 850 9911
Fax: +1 770 250 6199


